Mastering EED and CSRD Data Collection with Nlyte v16
Published on January 5, 2026,
by

The regulatory landscape for data centers is undergoing a seismic shift. For years, sustainability reporting was often a voluntary exercise in corporate social responsibility—a "nice to have" that looked good in an annual report. Today, that era is ending. With the implementation of the European Union’s Energy Efficiency Directive (EED) and the Corporate Sustainability Reporting Directive (CSRD), data centers are facing strict, mandatory requirements to disclose their environmental impact.
For data center managers and IT leaders, this transition represents a significant operational hurdle. The days of estimating power usage or relying on spreadsheet approximations are over. These new mandates demand precision, auditability, and granularity.
The challenge, however, isn't just about reading the regulations; it is about the mechanics of gathering the proof. This post serves as a practical blueprint for aligning your operations with these new mandates. We will explore how to leverage EED and CSRD data collection strategies using Nlyte v16 to turn a compliance burden into a competitive advantage.
The New Reality: Compliance is No Longer Optional
Before diving into the "how," it is crucial to understand the "why." The EED and CSRD are not merely bureaucratic hurdles; they are part of the EU’s aggressive push toward the Green Deal goals.
The Energy Efficiency Directive (EED) focuses heavily on the operational efficiency of the data center. It mandates the reporting of specific metrics such as Power Usage Effectiveness (PUE) and energy reuse. It requires operators to publicly report their energy performance, making efficiency a matter of public record.
The Corporate Sustainability Reporting Directive (CSRD) takes a broader view. It requires companies to report on the social and environmental impact of their activities. For data centers, this means rigorous reporting on greenhouse gas (GHG) emissions, particularly Scope 2 (indirect emissions from purchased electricity) and Scope 3 (value chain emissions).
The Risks of Inaction
The stakes are incredibly high. Non-compliance risks significant financial fines, but the reputational damage could be even more costly. In a market where hyperscalers and enterprise customers are prioritizing green supply chains, an inability to provide accurate EED and CSRD data collection reports can lead to lost contracts.
Furthermore, accurate data collection is not just about avoiding penalties. It is the foundation of operational excellence. You cannot optimize what you do not measure. By establishing a robust framework for data collection, you unlock insights that drive cost savings, capacity reclamation, and prolonged hardware lifecycles.
Step 1: Map Physical Assets to Location-Level Attributes
The journey to compliance begins with your asset inventory. However, a simple list of servers is no longer sufficient. Under the new regulations, where your energy is consumed is just as important as how much is consumed.
This is because carbon intensity varies by the power grid. A kilowatt-hour consumed in a region powered by coal has a different carbon footprint than one consumed in a region powered by hydroelectricity. To report Scope 2 emissions accurately, you must link every physical asset to its specific geographic and regulatory zone.
Implementation with Nlyte Software
Using Nlyte v16, you can move beyond flat asset lists to a multi-dimensional view of your infrastructure.
- Define Location Attributes: Configure your Nlyte instance to include specific attributes for regulatory zones, utility providers, and carbon intensity factors associated with each site.
- Granular Association: Ensure that every rack, PDU, and cooling unit is digitally tethered to these location attributes.
- Bulk Updates: If you are managing a large-scale estate, manual tagging is impossible. Utilize Nlyte’s bulk update features to apply these location tags across thousands of assets instantly.
By mapping physical assets to these attributes, you create the foundational layer for automated EED and CSRD data collection. This ensures that when an auditor asks for the emissions data of a specific site, the calculation is based on actual asset location rather than broad estimates.
Step 2: Normalize Power Telemetry
Once your assets are mapped, the next challenge is dealing with the raw data. Data centers are complex ecosystems filled with equipment from different vendors, PDUs from one manufacturer, UPS systems from another, and cooling units from a third. Each device speaks a different language, providing telemetry in different formats and intervals.
Raw data is often messy. It can contain gaps, spikes, or units of measurement that don't align. For regulatory reporting, "messy" is unacceptable. You need normalized, aggregated data that can stand up to scrutiny.
Creating a Unified Data Stream
Nlyte v16 acts as a Rosetta Stone for your data center infrastructure.
- Aggregation: It pulls power data from the rack level, the PDU level, and the facility level into a single repository.
- Normalization: The software standardizes this data in real-time. It converts varying signals into a unified format, allowing for consistent calculation of critical metrics like PUE and Data Center Performance Per Energy (DPPE).
- Gap Filling: Advanced DCIM tools can identify when a sensor has stopped reporting and alert operators, ensuring that your compliance reports don't have holes in them.
This step transforms disparate signals into actionable intelligence. It turns the noise of thousands of sensors into a clear, harmonic signal that regulators can understand.
Step 3: Tie Facilities Data to Reporting Entities
One of the biggest hurdles in EED and CSRD data collection is the historical silo between IT and Facilities.
Traditionally, the Facilities team manages the power and cooling (the building), while the IT team manages the servers and switches (the workload). The new directives essentially demand that these two worlds collide. To report accurately on efficiency, you must understand the relationship between the power entering the building and the useful work being done by the IT equipment.
Bridging the Gap
Nlyte v16 bridges this gap by integrating with Configuration Management Databases (CMDB) and IT Service Management (ITSM) systems.
- Logical vs. Physical: This integration allows you to map physical power consumption to logical business entities. You can see not just how much power a rack is using, but which business unit or application is driving that consumption.
- Audit-Ready Evidence: By connecting facilities data with corporate reporting structures, you create a chain of custody for your energy data. You can demonstrate exactly how energy flows through your organization to support specific business functions.
This integration is critical for assigning accountability. When you can show a department exactly how their application usage impacts the company's carbon footprint, you drive behavioral changes that support sustainability goals.
Step 4: Export Audit-Ready Dashboards
The final step in the blueprint is the output. Collecting data is useless if you cannot present it in a format that auditors accept.
Spreadsheets are prone to human error and version control issues. In the era of CSRD, relying on Excel is a liability. You need automated, immutable snapshots of your performance.
Visualizing Compliance
Nlyte v16 allows you to generate compliance-specific views that remove the manual labor from reporting.
- Energy Consumption by Site: Instantly visualize kWH consumption across different geographies.
- Carbon Footprint Analysis: Apply your location-based carbon intensity factors to your normalized power data to generate accurate emissions reports.
- Trend Analysis: Auditors look for progress. Use historical trending to show how your efficiency initiatives have reduced PUE over time.
By automating the "last mile" of EED and CSRD data collection, you free your team from weeks of manual data gathering every reporting cycle. Instead of scrambling to find data when an audit looms, you can simply export the dashboard.
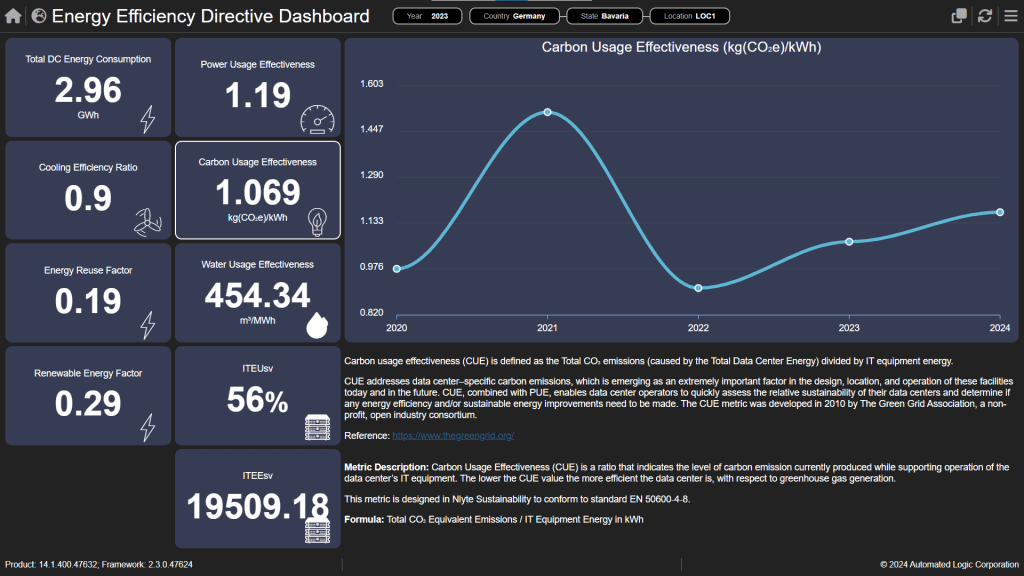
EU EED Location Level Dashboard with CUE selected
Conclusion
The shift toward mandatory sustainability reporting is transforming the data center industry. While the EED and CSRD mandates introduce new complexities, they also offer a framework for better management. By treating energy data with the same rigor as financial data, you gain a clearer picture of your operations.
Implementing a structured blueprint, mapping assets, normalizing telemetry, bridging IT and facilities, and automating reporting, is the only viable path forward. Tools like Nlyte v16 are no longer just about infrastructure management; they are essential compliance engines.
Don't let the complexity of regulations slow you down. By mastering EED and CSRD data collection now, you position your organization as a leader in the sustainable digital future.
Ready to Simplify Compliance?
Are you ready to stop worrying about audits and start optimizing your infrastructure? Nlyte's Data Center Sustainability Compliance Reporting can help you automate your sustainability reporting.
